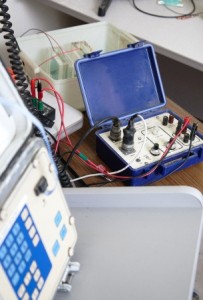
 Complex resistivity measurement method
Complex resistivity determinations are measured in the frequency or phase domain. CR responses are determined using a four-electrode sample holder with isolation amplifiers, measured by a Zonge GDP-series data processor. The resistance of each sample is measured and an equivalent resistor is inserted in the measuring setup to balance out any stray capacitance which may influence the high-frequency phase values.
Preparation
Rocks are cut to provide a sample between 2 and 4 cm in length with parallel planar ends, vacuum impregnated with distilled water, and additionally soaked in distilled water for three days. The exception to this procedure is when the samples are cored for magnetic measurements. Then the samples are made into 1.0 inch bicylindrical cores as described in the magnetic susceptibilities procedure.
Reported results
The results are the stacked and averaged values for 0.125, 1.0, and 8.0 Hz, including the 3rd, 5th, 7th, and 9th harmonics for each fundamental frequency. Complex-plane plots and magnitude/phase plots are presented along with tabulations of the spectral results, and apparent resistivity and phase at 0.125 Hz.
The spectral-type parameters are based on the slopes of the CR curves for the 0.125 to 1 Hz, 1 to 8 Hz, and 8 to 72 Hz data, using alphabetic notations of A, a, B, b, c, and C.
The range of slopes for each spectral type are:
          Type        Slope
            A       greater than 20%
            a          10%  to   20%
            B           0%  to   10%
            b           0%  to  -10%
            c         -10%  to  -20%
            C       less than   -20%
Considerations
Rock resistivities measured by laboratory techniques are often much higher than observed field resistivities. Lab measurements on small core samples do not adequately sample the large-volume resistivities, which are grossly influenced by fractures and faults containing mineralized solutions. Fresh drill core samples that have not been exposed to the air or to elevated temperatures will sometimes yield representative rock resistivities in the laboratory. CR induced polarization values determined in the laboratory for disseminated sulfide samples are not similarly affected.
Lab measurements on small core samples are often more representative of the macroscopic induced-polarization responses, and usually correlate very well with surface measurements. Exceptions to this are cores which contain massive sulfide mineralization or which contain through-going, mineralized fractures or veinlets.

