
TEMAVG-W TEM data averaging and quality control
- Reads field data from Zonge GDP .raw, .dnt, .cac and .zdb files.
- Review Data function allows interactive quality control while viewing data in pseudosection or transient curve plots.
- Saves averaged data in .avg file, unaveraged data in a .zdb (Zonge data base) file.
- Re-reads .zdb files to revisit data skipping decisions.
- Option to save averaged data in Australian AMIRA-format.
- Reads and writes survey configuration and processing control files from .mde files, making it easier to duplicate a specific processing sequence when processing multiple, GDP TEM data files.
Current version and build: 1.20c Latest update: 2/Feb/2015

Survey configuration for TEM data
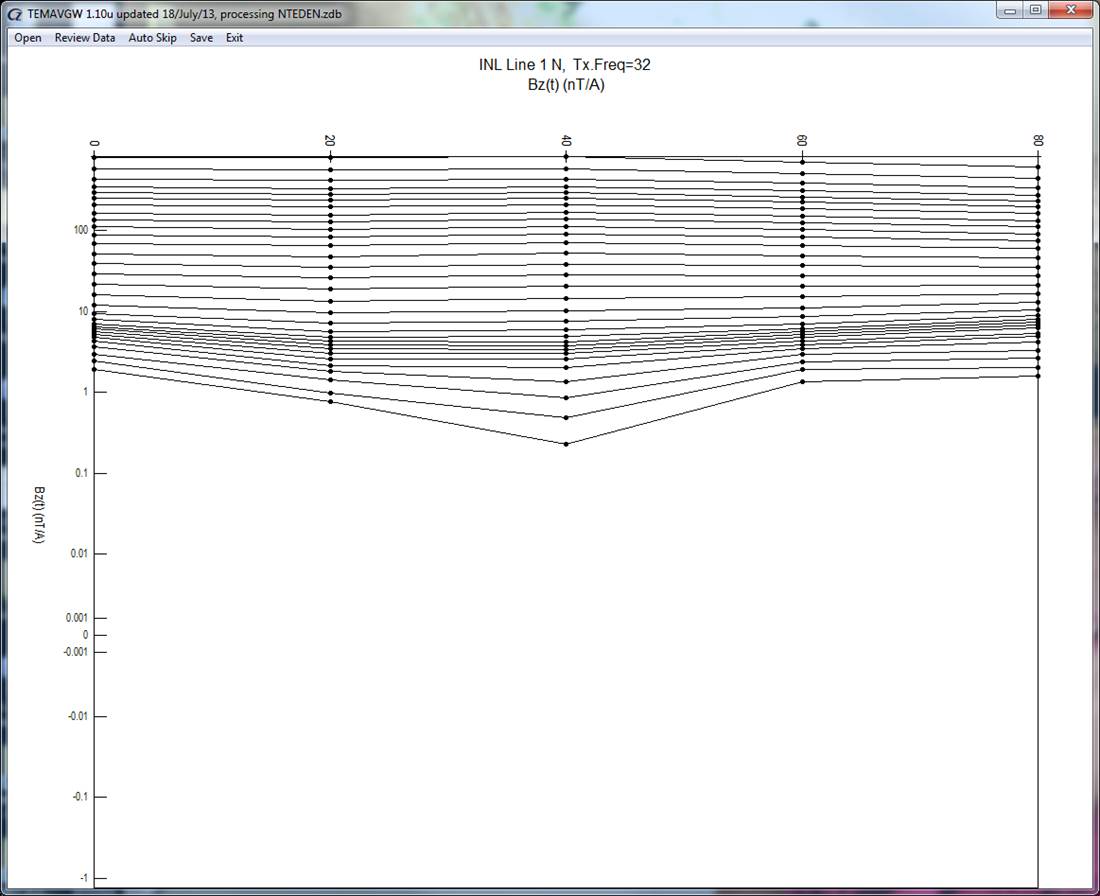
Examine TEM data as a pseudo-section with profile lines tracing transient amplitudes for each time window along the length of the line (station numbers versus asinh (B)).
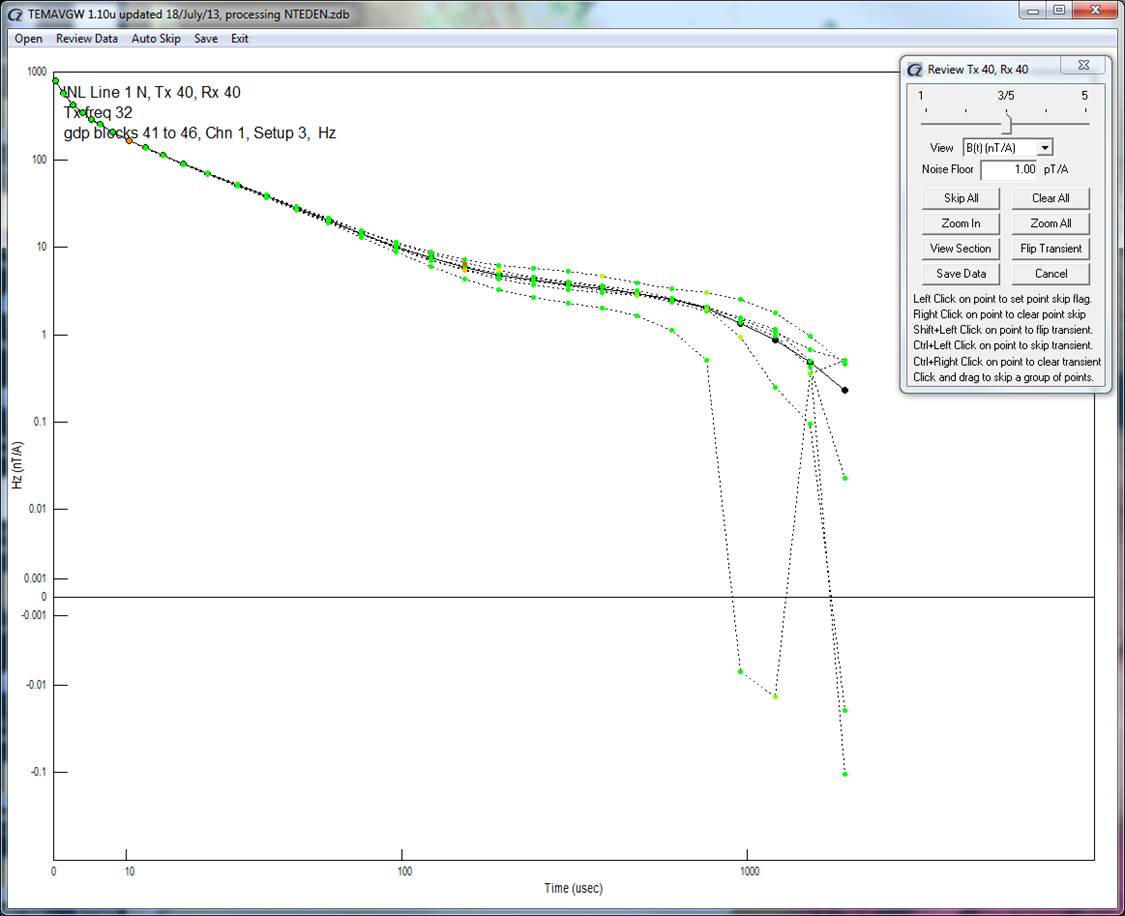
Examine transient plots show TEM data for one component at one station (asinh(t) versus asinh(B)). Edit metadata, add or remove individual repeat data points.
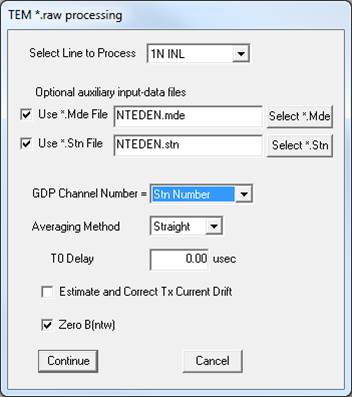
Processing control options for TEM data
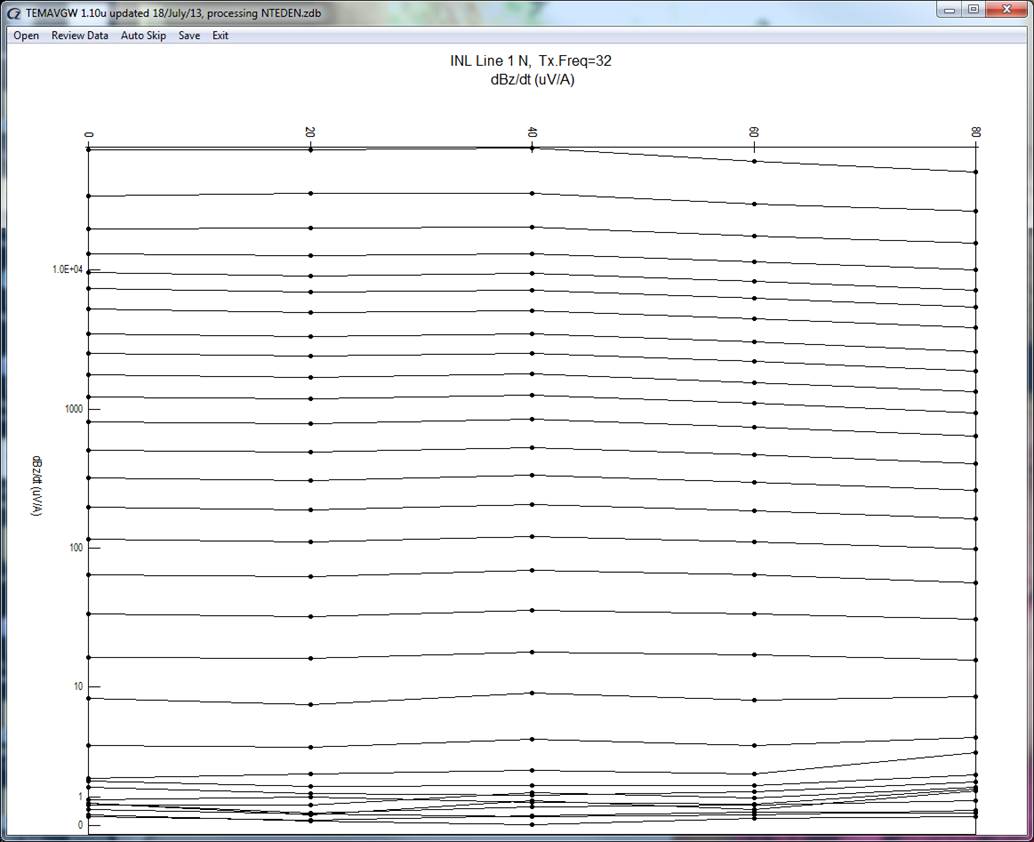
Examine TEM data as a pseudo-section with profile lines tracing transient amplitudes for each time window along the length of the line (station numbers versus asinh (dB/dt)).

Examine transient plots show TEM data for one component at one station (asinh(t) versus asinh(dB/dt)). Edit metadata, add or remove individual repeat data points.